


Innovation & Insights
EtaPRO® APR • Video • August 13, 2026
How to Analyze Power Plant Data with XY Plots and Curve Fitting
Analyzing relationships between operating parameters often means exporting plant data to a spreadsheet and building charts manually. EtaPRO provides another option using its built-in trending tools to visualize plant data, create XY plots, perform curve fits, and generate curve-fit coefficients directly from the application.
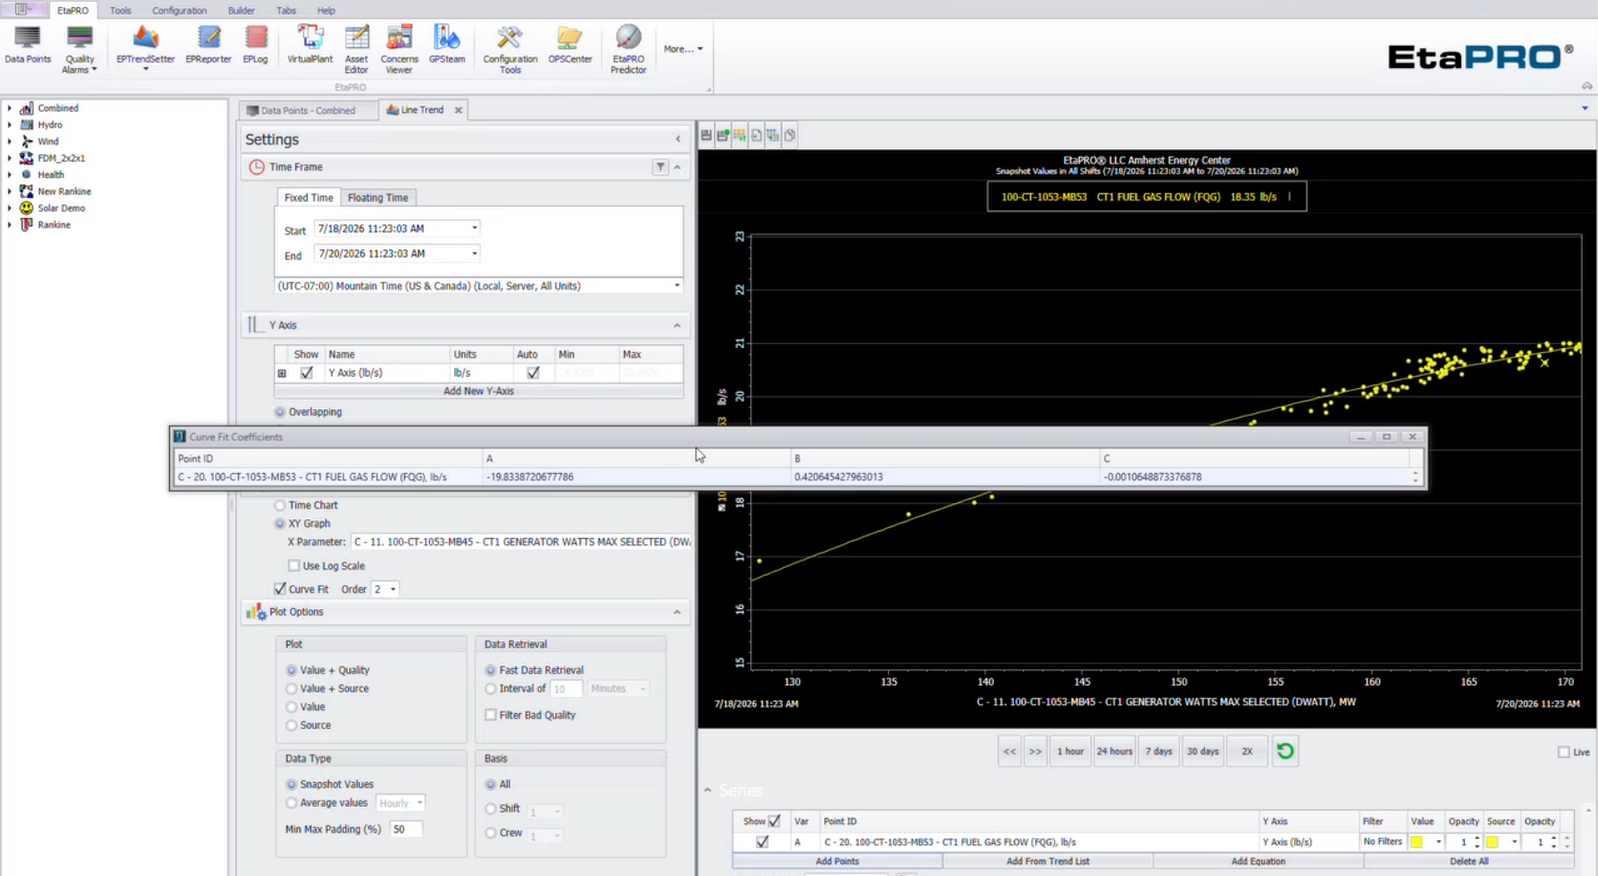
In this short demonstration, you'll see how EtaPRO's EP TrendSetter can be used to plot gas turbine generation against fuel gas flow, apply a second-order curve fit, and automatically generate the coefficients for the resulting curve.
What this Demonstration Shows
The video demonstrates how to use EtaPRO's trending capabilities to:
- Select a fixed time period for analysis
- Create an XY graph from plant operating data
- Plot CT1 generation on the X axis
- Plot fuel gas flow on the Y axis
- Apply a curve fit to the data
- Overlay a second-order curve fit on the XY plot
- Automatically generate the curve-fit coefficients
- Copy the coefficients for use in Excel, EtaPRO, or another application
- Use the resulting relationship to create an expected value within EtaPRO
This provides a quick way to analyze relationships between operating parameters without first exporting the data to Excel.
Analyze Plant Data Without Leaving EtaPRO
Power plant operating data can contain useful relationships between measurements that aren't always apparent when looking at individual trends.
For example, comparing gas turbine generation with fuel gas flow can help establish the relationship between these two variables. An XY plot makes that relationship easier to visualize, while curve fitting provides a mathematical representation of the relationship.
With EtaPRO's EP TrendSetter, this analysis can be performed directly using plant data already available in the system.
Create an XY Plot
The first step is to select the time period and variables to be analyzed.
In this demonstration, CT1 generation is selected as the X-axis variable, while fuel gas flow is selected as the Y-axis variable. EtaPRO then plots the two variables against each other rather than displaying them simply as trends over time.
This makes it possible to examine how fuel gas flow changes as generation changes.
Apply a Curve Fit
Once the XY plot has been created, EtaPRO can overlay a curve fit on the data.
In the demonstration, a second-order curve fit is selected. The fitted curve provides a mathematical representation of the relationship between generation and fuel gas flow.
This can be useful when establishing an expected relationship between operating parameters and identifying deviations from that expected behavior.
Generate Curve-Fit Coefficients
EtaPRO can automatically generate the coefficients associated with the curve fit.
By selecting Curve Fit Coefficients, the coefficients for the fitted relationship are displayed and can be copied for use elsewhere.
The video demonstrates copying the coefficients so they can be pasted into another application such as Excel or used within EtaPRO itself.
Create an Expected Value in EtaPRO
The curve-fit coefficients can also be used to create an EtaPRO point that generates an expected value.
This opens up additional possibilities for performance monitoring and diagnostics. Instead of simply viewing the historical relationship between two parameters, the relationship can become part of an expected-value calculation within EtaPRO.
Expected values can then provide a basis for comparing actual plant behavior against an established relationship.
Why This Matters for Power Plant Performance Monitoring
Being able to quickly analyze relationships between plant parameters can help engineers and operators investigate performance without moving data between multiple applications.
Using EtaPRO's trending and curve-fitting capabilities, users can:
- Analyze relationships between operating parameters
- Visualize performance data with XY plots
- Apply mathematical curve fits to operating data
- Generate curve-fit coefficients automatically
- Create expected values from established relationships
- Perform analysis without first exporting data to Excel
The result is a more integrated approach to plant data analysis and performance monitoring.
Example: Gas Turbine Generation and Fuel Gas Flow
The example in this demonstration uses CT1 generation and fuel gas flow.
Generation is plotted on the X axis, while fuel gas flow is plotted on the Y axis. A second-order curve is then fitted to the data.
The resulting equation describes the relationship represented by the historical operating data. Its coefficients can be copied and used to establish an expected-value relationship within EtaPRO.
This type of analysis can be applied to other combinations of plant measurements where an expected relationship can provide useful performance information.
Frequently Asked Questions
Can I analyze plant data in EtaPRO without using Excel?
Yes. The demonstration shows how EtaPRO's EP Trend Setter can be used to create XY plots and perform curve fitting directly from the application. Curve-fit coefficients can also be copied into Excel or another application when needed.
What is an XY plot used for in power plant data analysis?
An XY plot allows two plant variables to be compared against one another rather than simply plotted against time. This can help identify relationships between operating parameters.
Can EtaPRO perform curve fitting?
Yes. The demonstration shows a second-order curve fit being applied to an XY plot within EP Trend Setter.
Can I get the coefficients from the curve fit?
Yes. EtaPRO automatically generates the curve-fit coefficients, which can be selected and copied for use in other applications or within EtaPRO.
Can curve-fit results be used to create expected values?
The demonstration shows how the curve-fit coefficients can be used to create an EtaPRO point that generates an expected value.
What types of plant data can be analyzed?
The video demonstrates the technique using CT1 generation and fuel gas flow. The specific parameters used in an analysis can be selected according to the relationship being investigated.
Video Transcript
What's a quick way to look at your data in EtaPRO without having to use Excel?
Well, I'm going to go ahead and show you by going to the EP Trend Setter here. And this is the trending tool that we have with EtaPRO.
So, first we enter our start and end times for fixed time. And then I'm going to go down and let's do an XY graph.
So, I'm going to use the X axis here, select XY graph. And I want to look at the generation for CT1 on the X axis.
And then I'm going to select curve fit here, and we can actually do an overlay of the curve fit. And I'm going to go with a second order curve fit.
And then I'm going to add my Y variable. And for this, I want to look at fuel gas flow and have that plotted against generation.
And there's our plot, and we can see it did a curve fit right over it.
And then the next thing I want to do here is right click and go down to curve fit coefficients.
And this automatically generates the curve fit coefficients for you, and you can go ahead and highlight it rows A, B, and C. And copy, and then you can go ahead and paste into any program you want from there, whether it's Excel or whether you want to paste it within EtaPRO.
And you could create an EtaPRO point that will generate an expected value.
Related Resources
You might also be interested in:
Video: How to Monitor Turbine Inlet Filter Differential Pressure and Automate Alerts
Learn how to configure diagnostics and automate alerts in EtaPRO.
Article: How to Identify and Quantify Performance Losses in Power Plants Using Digital Twins
Learn how combining pattern recognition digital twins and physics-based digital twins can find and value deviations singular twins can't.
See EtaPRO in Action
EtaPRO helps power producers transform operating data into actionable intelligence through continuous performance monitoring, diagnostics, and automated notifications.
Contact us to schedule a personalized demonstration or learn how EtaPRO can improve the reliability and performance of your generating assets.
About Andrew Ryder
Andrew Ryder is a Business Development Manager at EtaPRO and a long-time user of the EtaPRO monitoring and diagnostics platform. He served as a Power Plant Performance Engineer at Colorado Springs Utilities for more than five years responsible for thermal performance monitoring, testing, analysis, and optimization across the utility's generation fleet before joining EtaPRO. Andrew has conducted ASME Performance Test Code (PTC) guided performance tests and equipment-level evaluations, from pump testing to coal fineness testing, parametric studies to support outage work justification, plant performance trending, and more.